(著)山たー
とりあえず書いた。平均と分散の信頼区間も出せるようにした。
結果
       Estimate     lwCI      upCI
mu    -0.039926 -0.04378 -0.036072
sigma  0.980826  0.85298  1.093508
コード
import numpy as np
import matplotlib.pyplot as plt
import pandas as pd
from scipy.stats import t, chi2
# mean and standard deviation
mu, sigma = 0, 1
# generate toy data
s = np.random.normal(mu, sigma, 500)
# estimated value
e_mu = np.mean(s)
S2 = np.var(s, ddof=1)
e_sigma = np.sqrt(S2)
# plot histgram
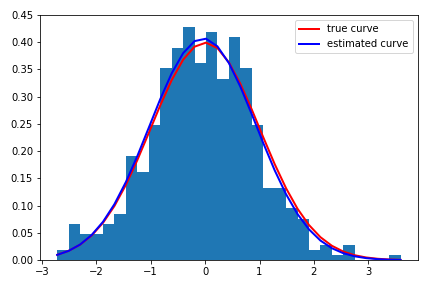
count, bins, ignored = plt.hist(s, 30, density=True)
# true curve
truth = 1/(sigma * np.sqrt(2 * np.pi)) *np.exp( - (bins - mu)**2 / (2 * sigma**2))
# fitted cureve
estimated = 1/(e_sigma * np.sqrt(2 * np.pi)) *np.exp( - (bins - e_mu)**2 / (2 * e_sigma**2) )
# plot result
plt.plot(bins, truth, linewidth=2, label ="true curve" ,color='r')
plt.plot(bins, estimated, linewidth=2, label ="estimated curve", color='b')
plt.tight_layout()
plt.legend()
plt.savefig("test.png")
plt.show()
# estimate 95% confidence interval of mu
# use t distribution
alpha = 0.025
n = len(s)
StdError = e_sigma / n
t_q = t.isf(q=alpha, df=n-1)
mu_CI = (e_mu - t_q*StdError, e_mu + t_q*StdError)
# estimate 95% Confidence interval of mu
# use chi2 distribution
chi2_q_lower = chi2.isf(q=alpha, df=n-1, loc=0, scale=1)
chi2_q_upper = chi2.isf(q=1-alpha, df=n-1, loc=0, scale=1)
sigma_CI = ((n-1)*S2/chi2_q_lower, (n-1)*S2/chi2_q_upper)
# print result
mat = np.vstack(((e_mu,e_sigma),
(mu_CI[0],sigma_CI[0]),
(mu_CI[1],sigma_CI[1])))
df = pd.DataFrame(mat.T, index=["mu", "sigma"],
columns=("Estimate", "lwCI","upCI"))
print(df)
コメントをお書きください